Function & Action debugger (Beta)
Introduction
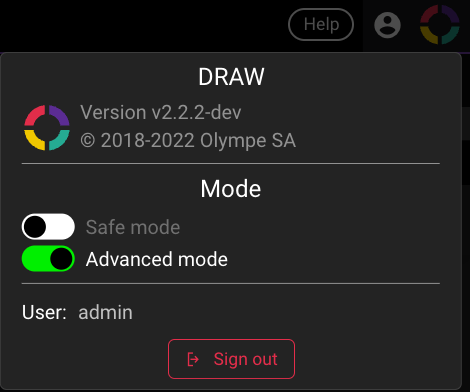
The Function/Action debugger has been introduced, in Beta version, in release 2.2. Because it’s in beta, it will appear only when Draw is set in advanced Mode:
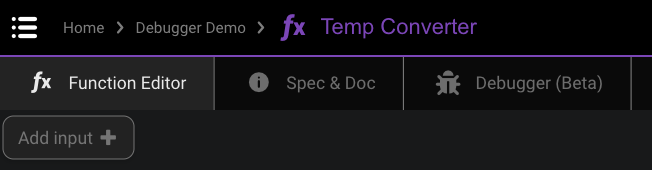
Once you have enabled the advanced mode a new tab will appear in the Function/Action editor:
The debugger is a powerful tool that will help you test, and debug, any function or action in your project. In particular it will show you the values going through the pipes at any given time instead of just the input and output values of traditional tests. It has 2 operation modes: Local testing & Remote debugging. The first one is intended for testing the function in isolation while the remote debugger let you monitor the function as it is running in an existing application (UI App or Service App) in real time, as long as it is connected to the same data-cloud.
We will now detail both these operation modes.
Local Testing
This is the default operational mode when you first enter the debugger tab:

This is a read-only view of the selected function, so while you can not change the function itself, you can still zoom in or out as well as move around. If you need to make changes to the actual function, you will have to go back to the first tab (Function Editor).
Now the first difference you will notice is the presence of buttons with this icon: ![]()
It indicates where you can enter values for testing. The most logical place to do so is in the inputs of the function, the blue boxes on the left hand-side. In our case Temp, F to C & Precision.
When you click on the button, a popup will let you enter the value:
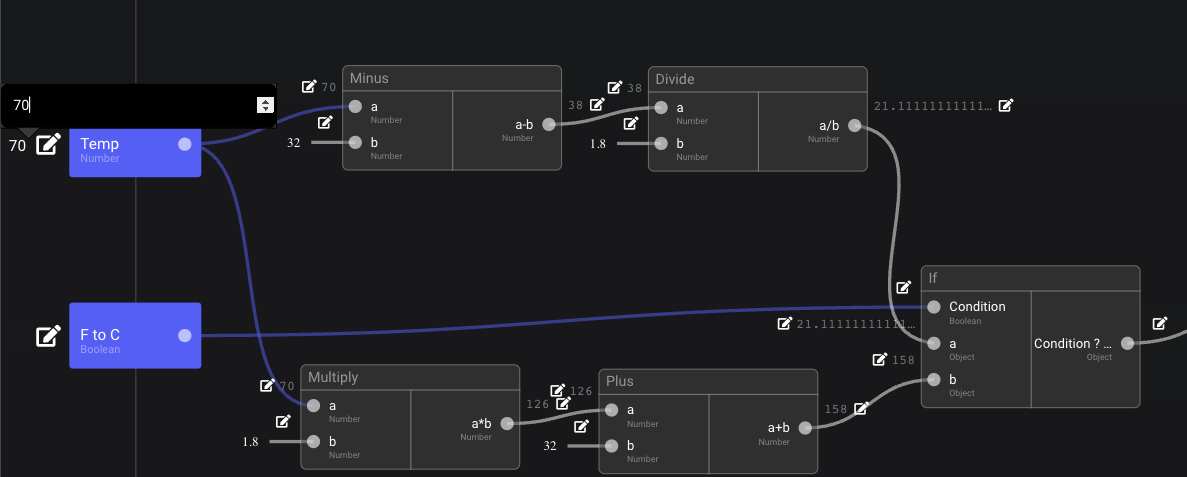
You will noice that the value is immediately propagated along the pipes it is connected to and calculations are performed when possible. Since some values are not provided yet, the flows stop quickly. Let’s enter values for the other 2 inputs:
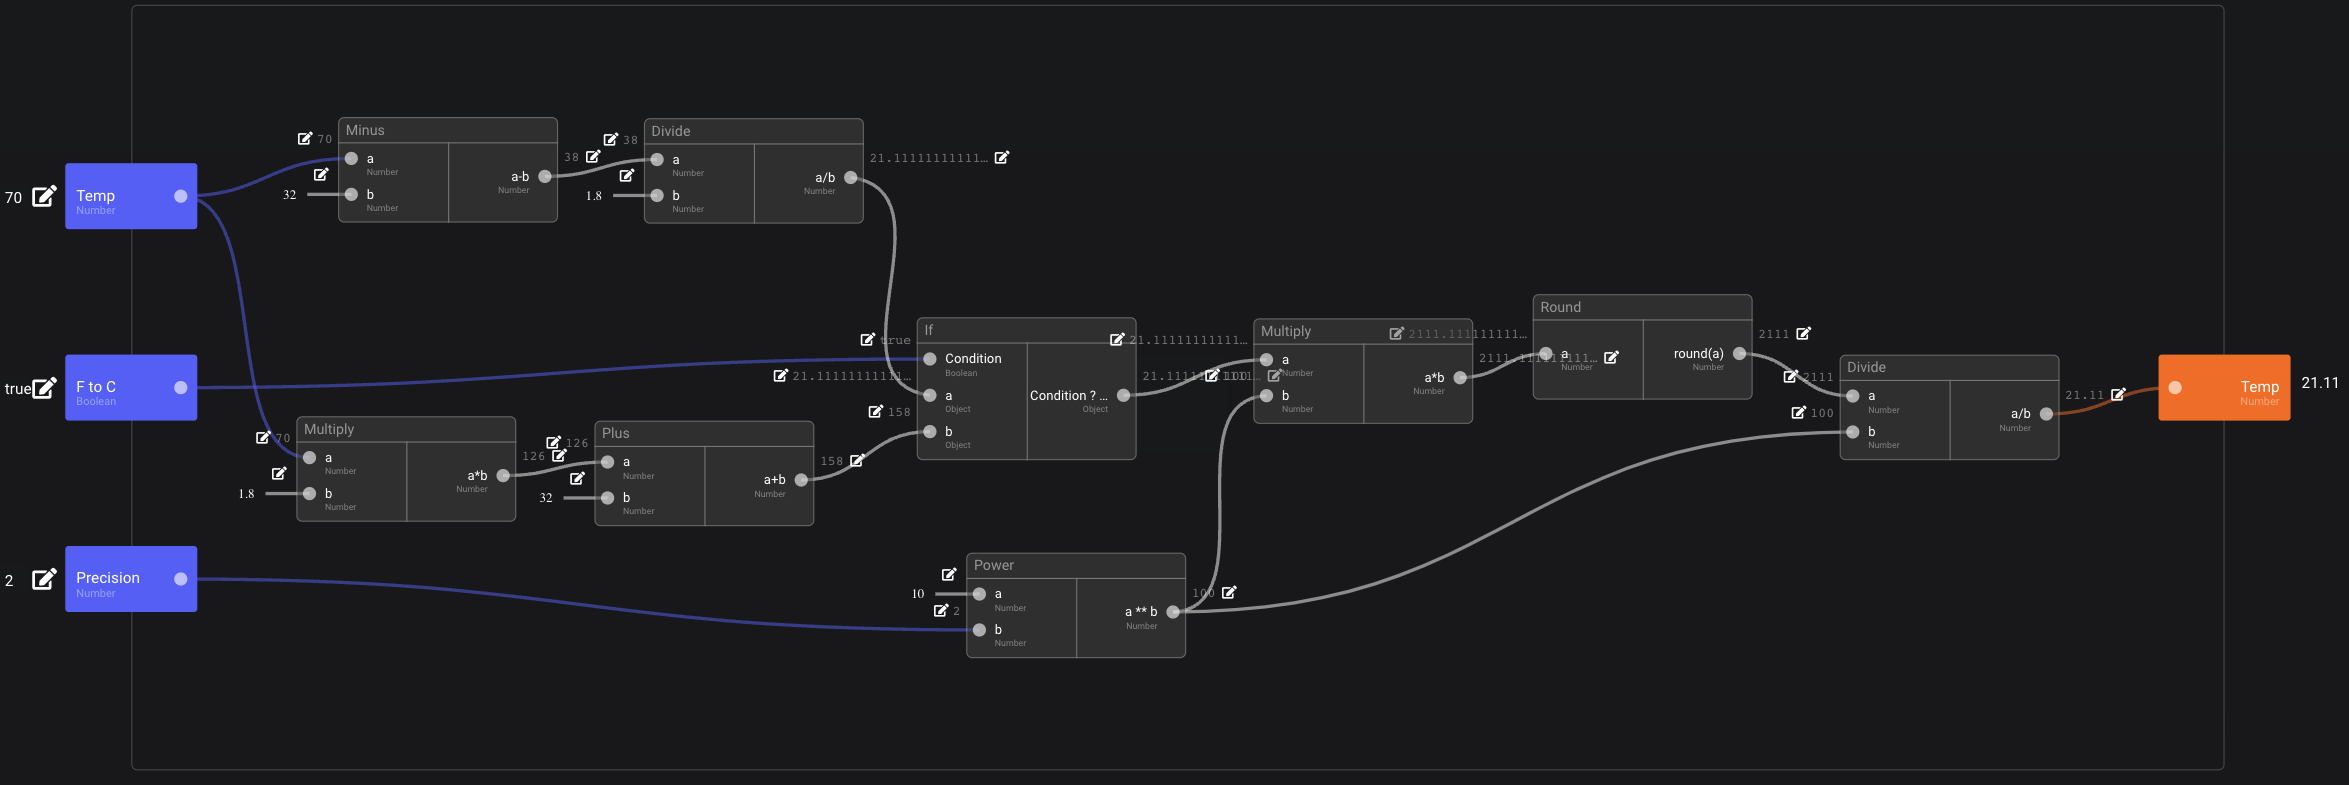
Now that all input values have been entered we can see that we do have an output value (21.11 in our case). Changing any of the input values will trigger automatic re-calculations where necessary and the display will change accordingly. Note that values that change are briefly animated with a short ‘pulse’ to help identifying the changes.
Finally it is also possible to edit an intermediary value in case we would want to test a narrower part of the function:

Let's now take a look at an Action instead of a Function:
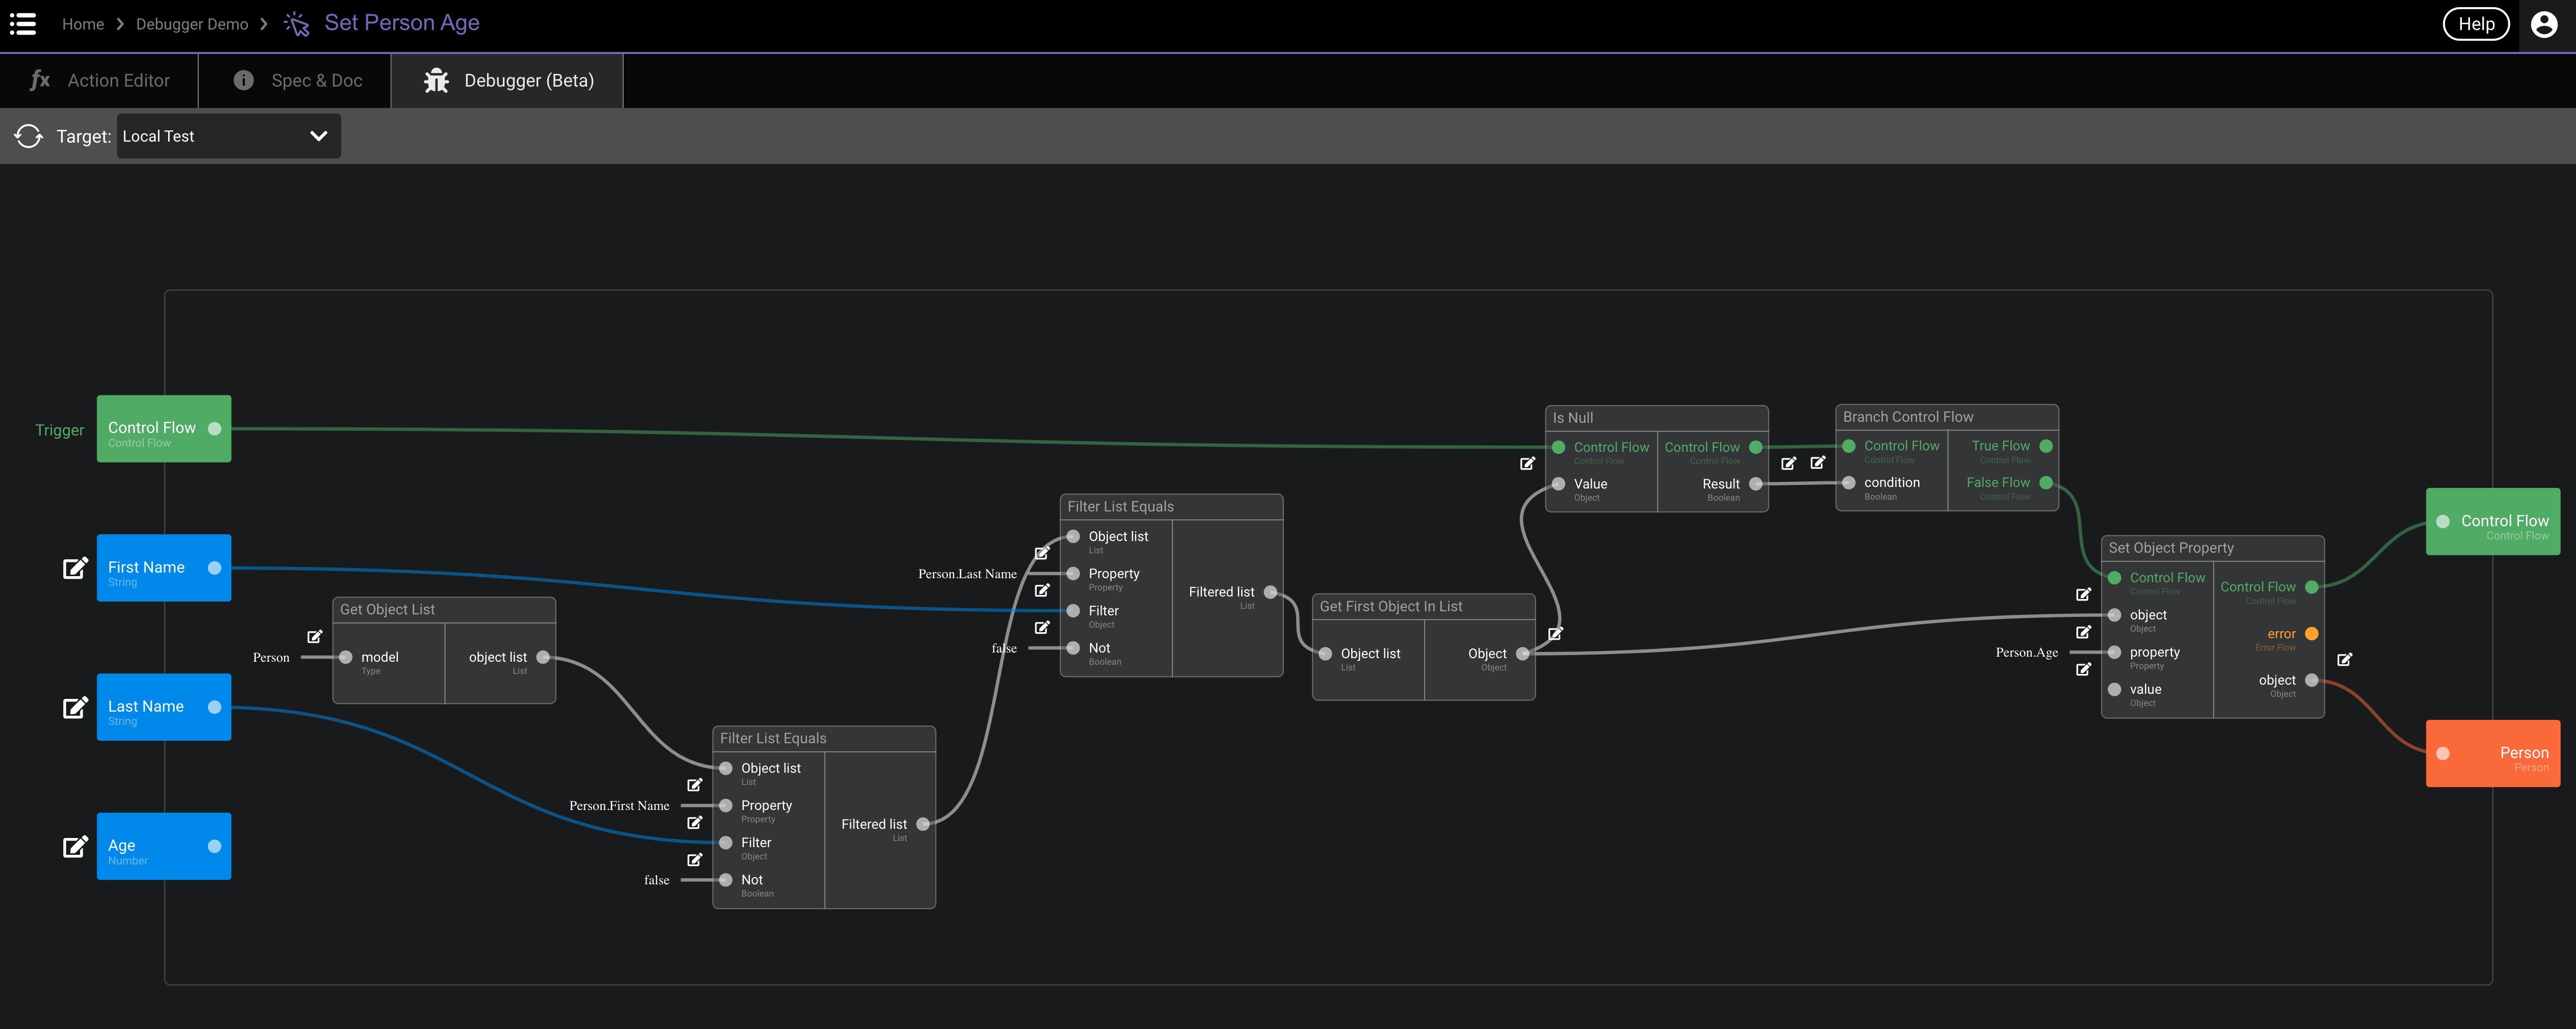
The main difference is that Control Flows are triggered instead provided with an input value:
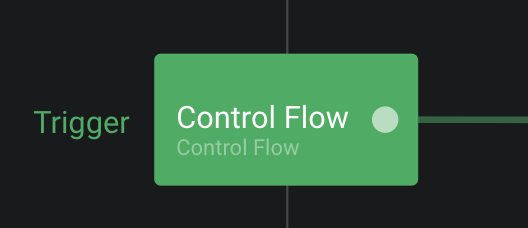
Clicking on the Trigger button will send the event along the pipes connected to that Control Flow input. Note that when a Control Flow has been triggered, the value displayed in the debugger will be a timestamp allowing you to track the timelines of the events:
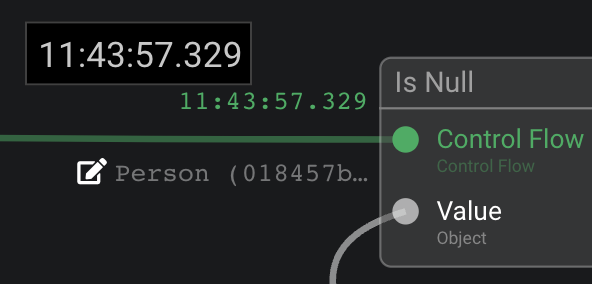
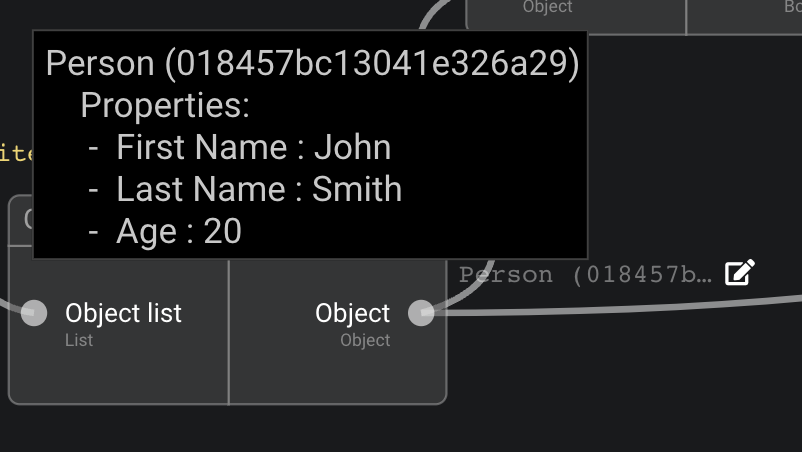
Finally when the output of a brick is a complex value, like a list or an Object, the debugger will display either the number of entries in the list or a String representation of the Object. You can get more details by hovering the mouse over the value.
List:

Object:
Remote Debugger
The remote debugger is used to connect to a running application and monitor an instance of the function being debugged. For this to be possible the following conditions have to be met:
- The application must have at least one instance of the function/action being debugged.
- The application must be connected to the same data-cloud (orchestrator) as the instance of DRAW being used.
- The application has to be configured to allow remote debugging, which is not the case by default. This is done by giving a value to the
sc.debuggerconfig variable which can be set either in the oConfig.json file of the application or as a parameter in the URL when launching a UI app. This parameter should be set to the name you want to give to that instance for reference in the debugger.
Here is an example of an URL for launching a UI app for debug under the name app1:

One simple way to launch a UI app with the debugger enabled is to use the Run App for Debugging button in the ScreenFlow editor:

Connecting to remote App
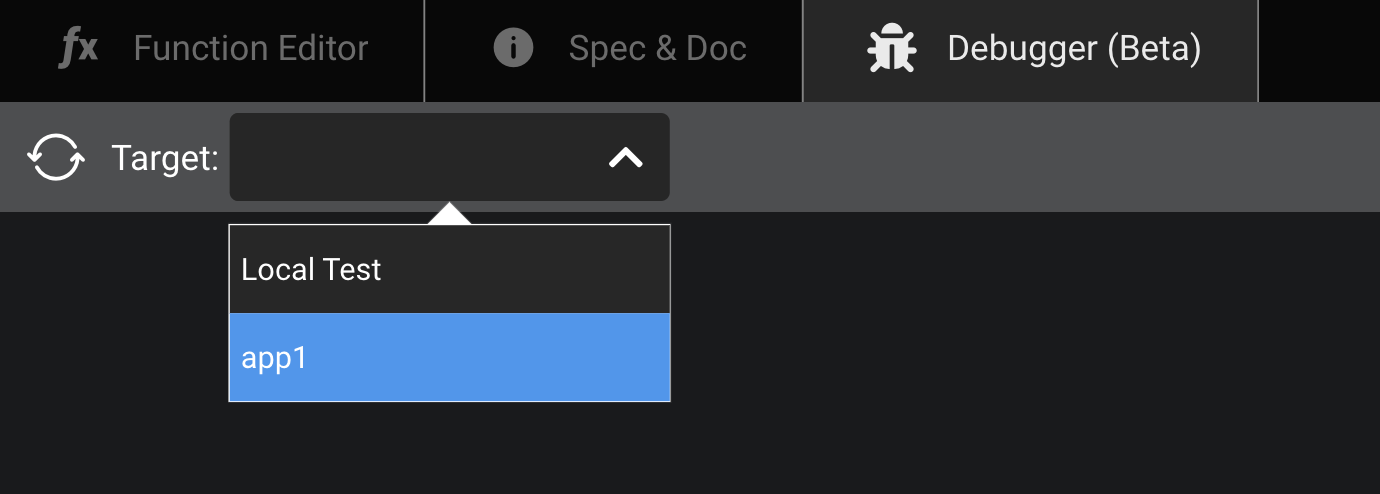
Now, if you go to the Debugger tab you should see the application in the Target dropdown:
Selecting it will connect to the application and retreive the path of all the instances of the function you are editing/debugging. An Instance Path dropdow will appear with that list:
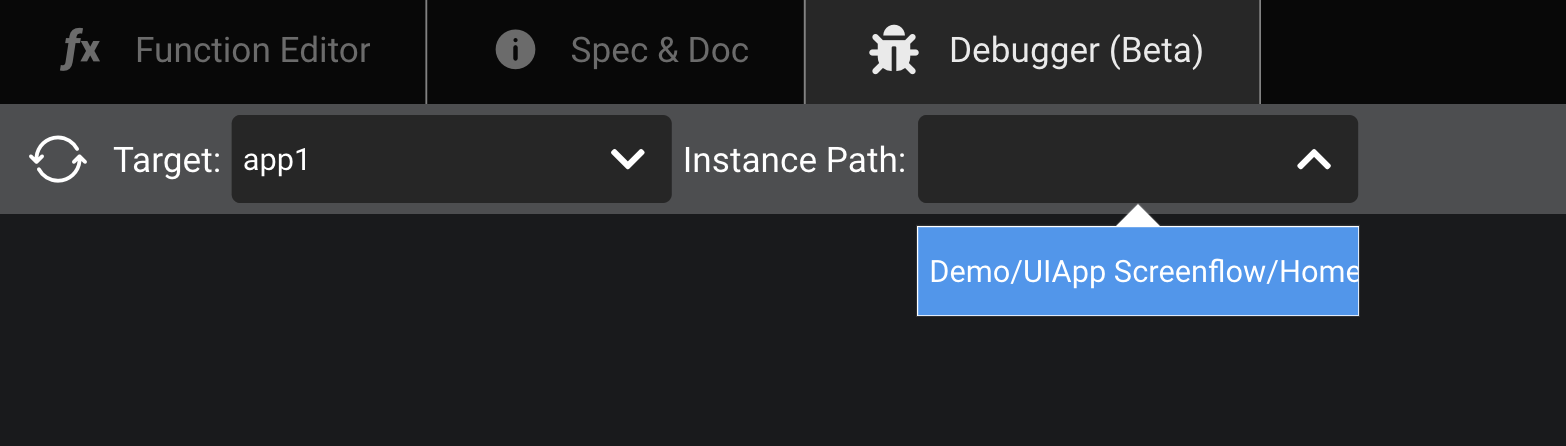
Select the path you want to monitor, and voila the debugger now shows you the live values in that application:
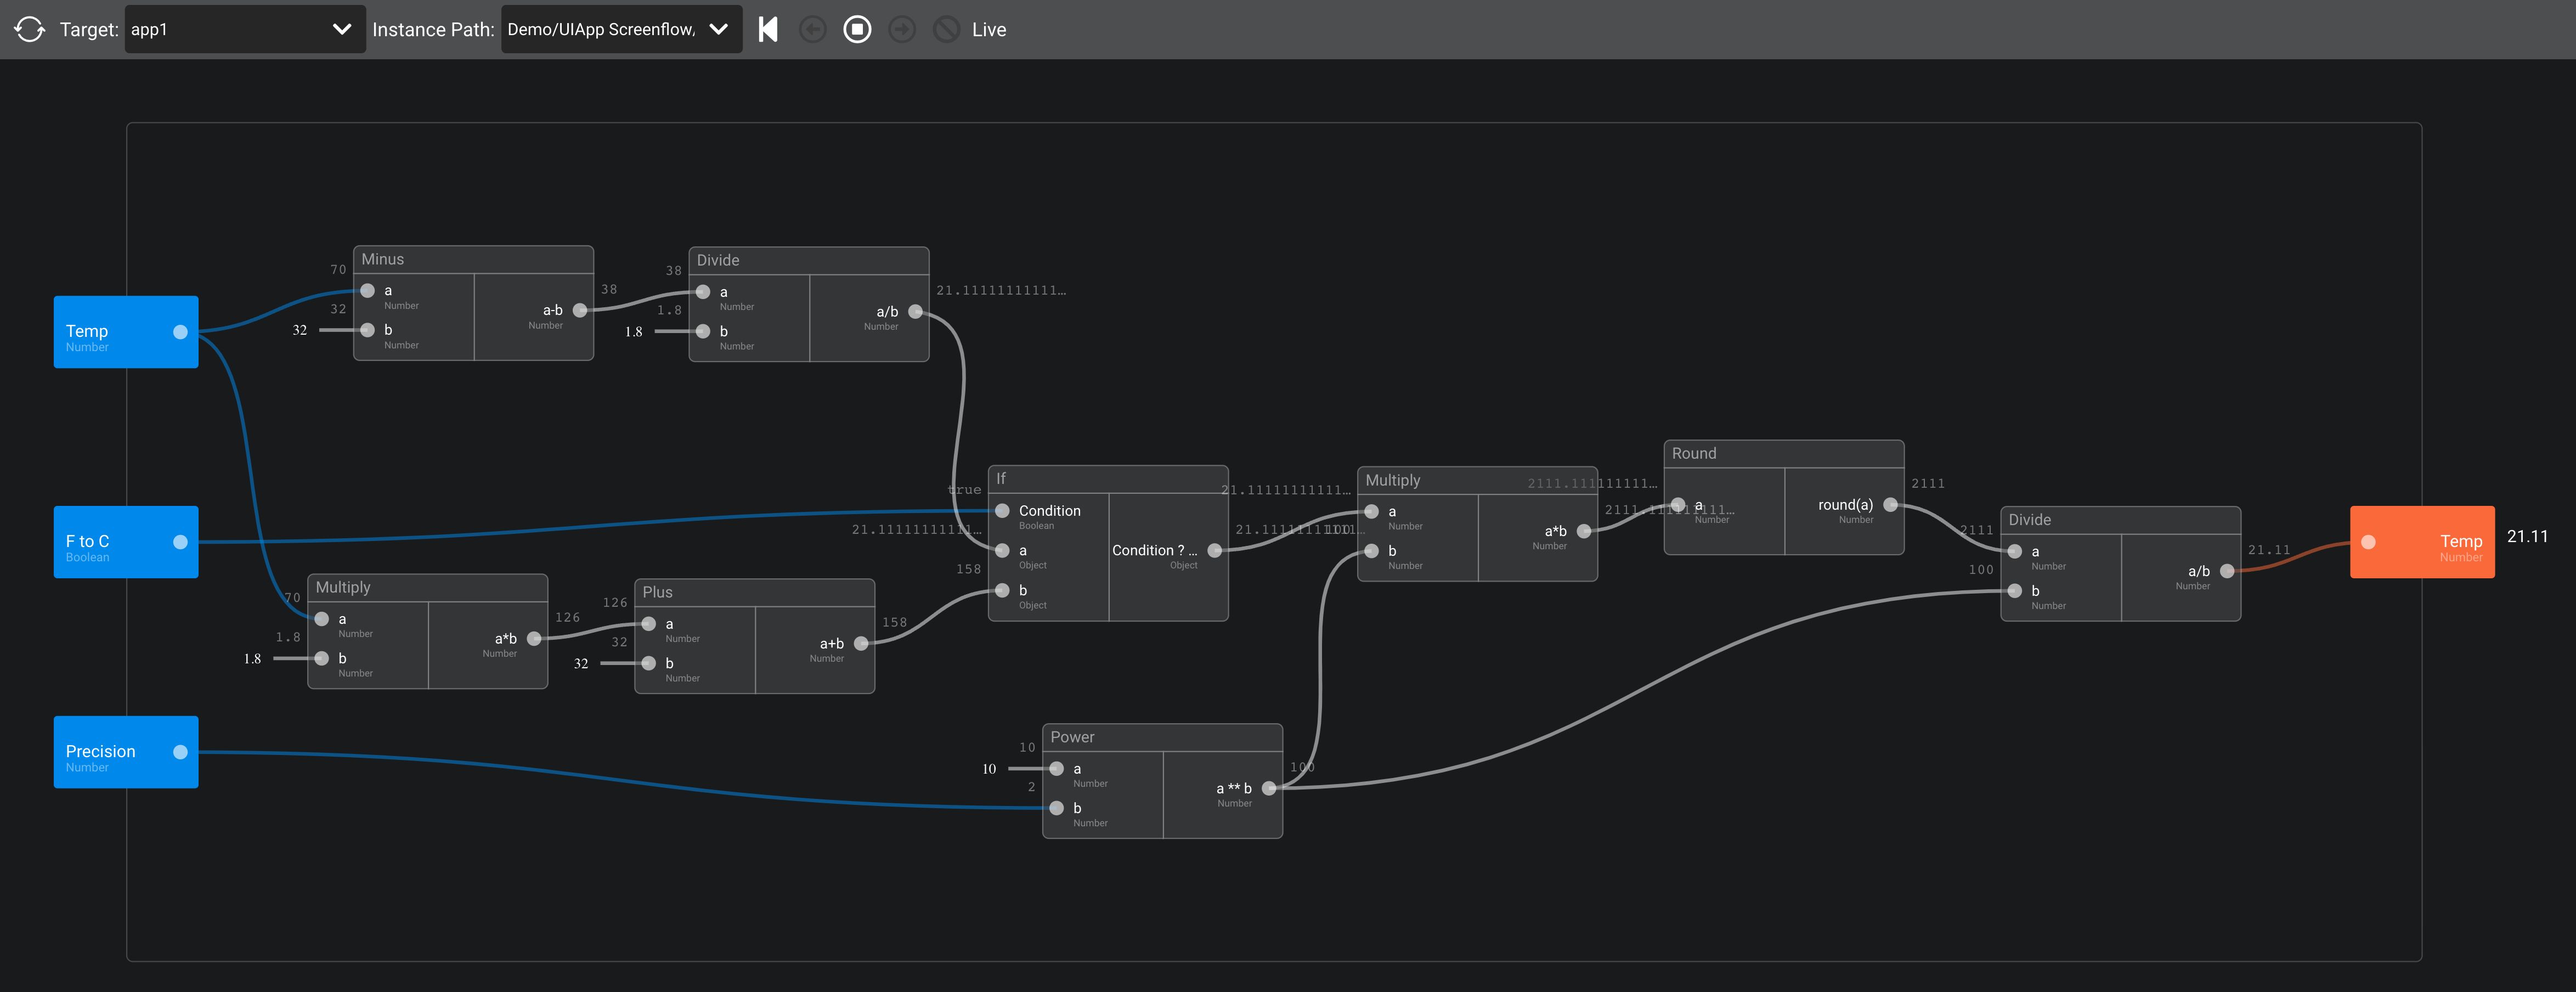
Any change will be immediately reported.
Recording
Because changes coming from the remote app being debugged can be very fast, the debugger provides a record/playback tool so that you can play these changes at your own speed. The recording tool controls will appear as soon as you connect to the remote application, on the right side of the path selection dropdown:

By default no recording is happening, and the status is said to be Live. To start recording press the Record button:
The debugger will start recording all the events in that function. The status will reflect that it is recording:
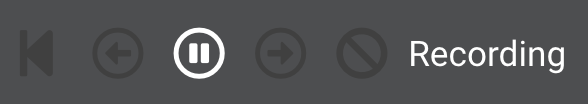
To stop recording, just press the pause button. The status will return to Live again.
To start the playback just press the Rewind button at the left end of the controls:

You can now move foward and backward in the events by pressing the arrows. The display will be updated with the corresponding changes:
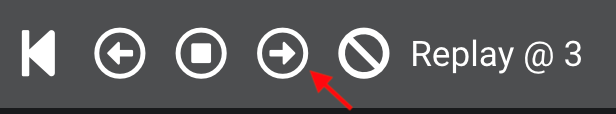
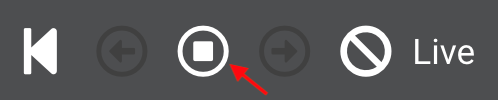
Finally, to stop the replay and go back to the live status, just press the Clear button to the right end of the controls:
![]()
The debugger is now back to Live and you can start a new recording session whenever you want.